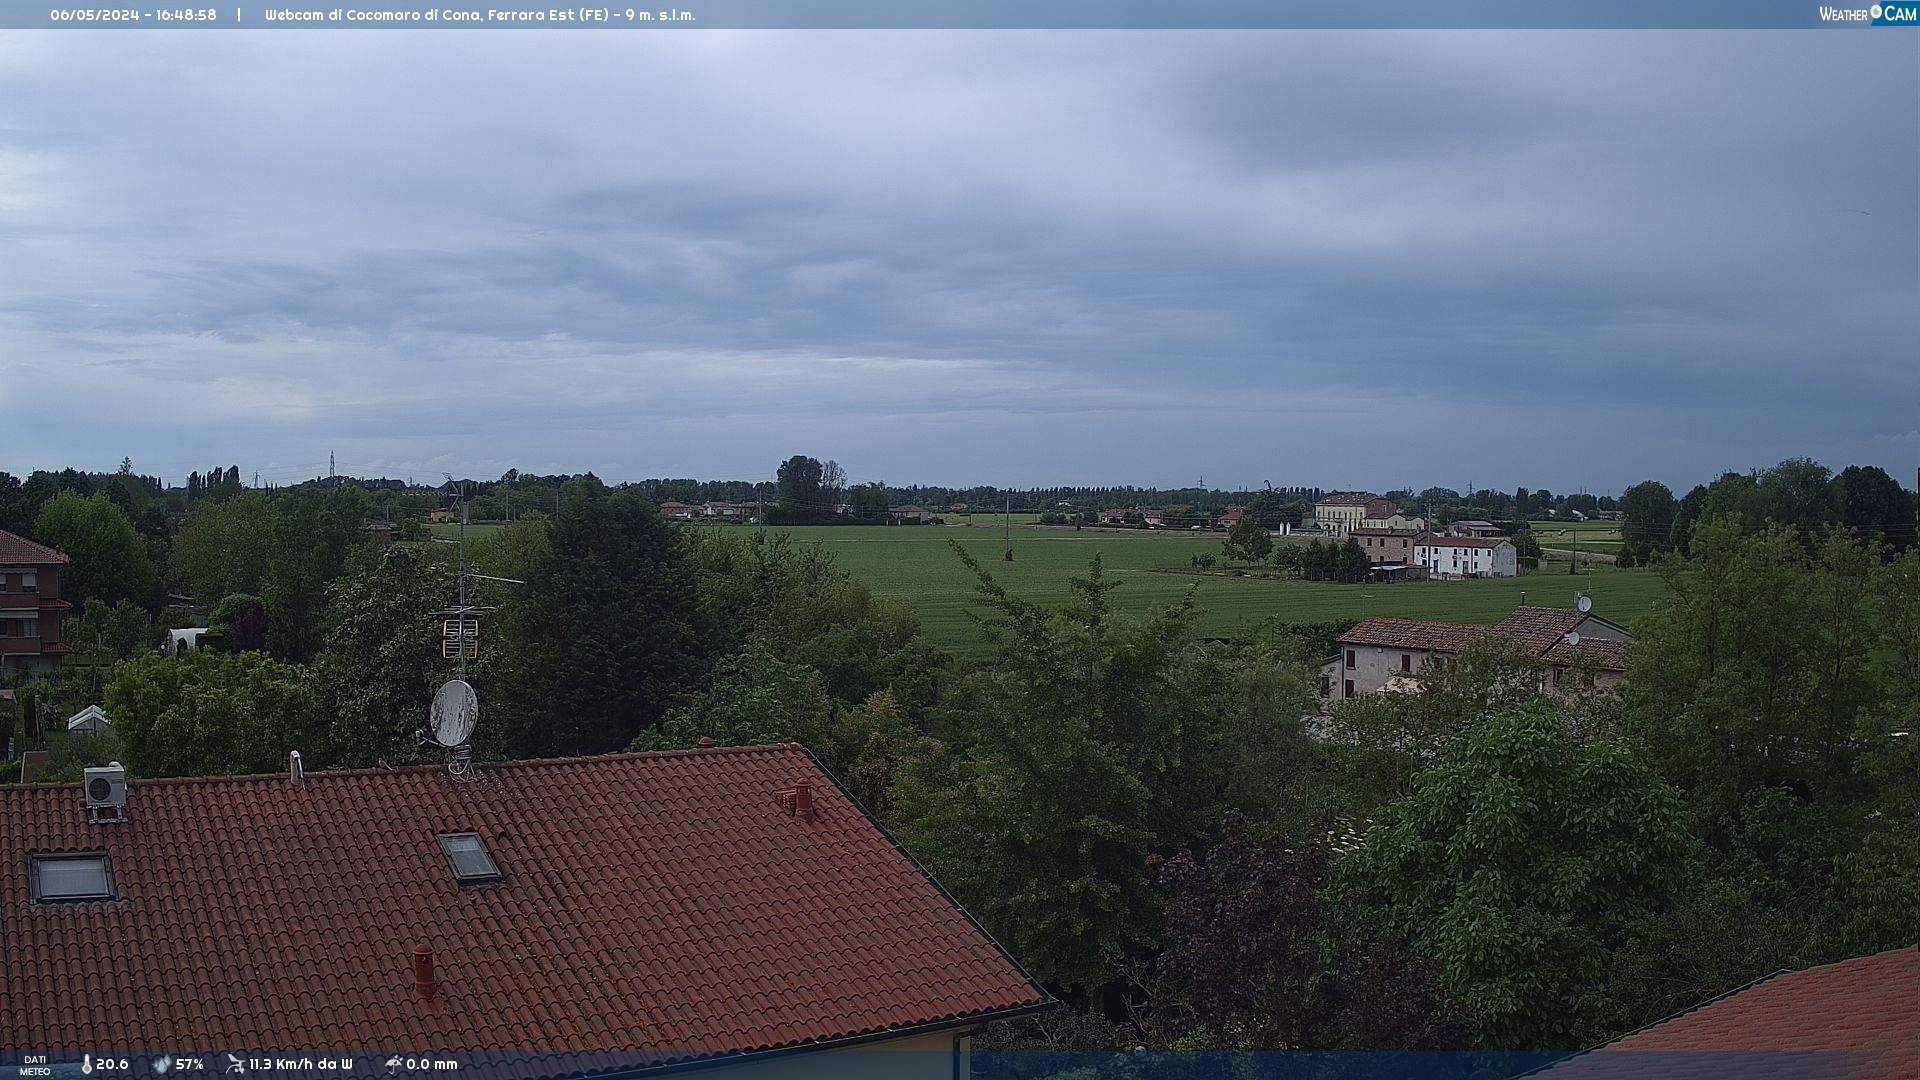
Osservatorio Meteorologico di Cocomaro di Cona (FE)
6 m. s.l.m. - Ferrara, Emilia Romagna, Italy
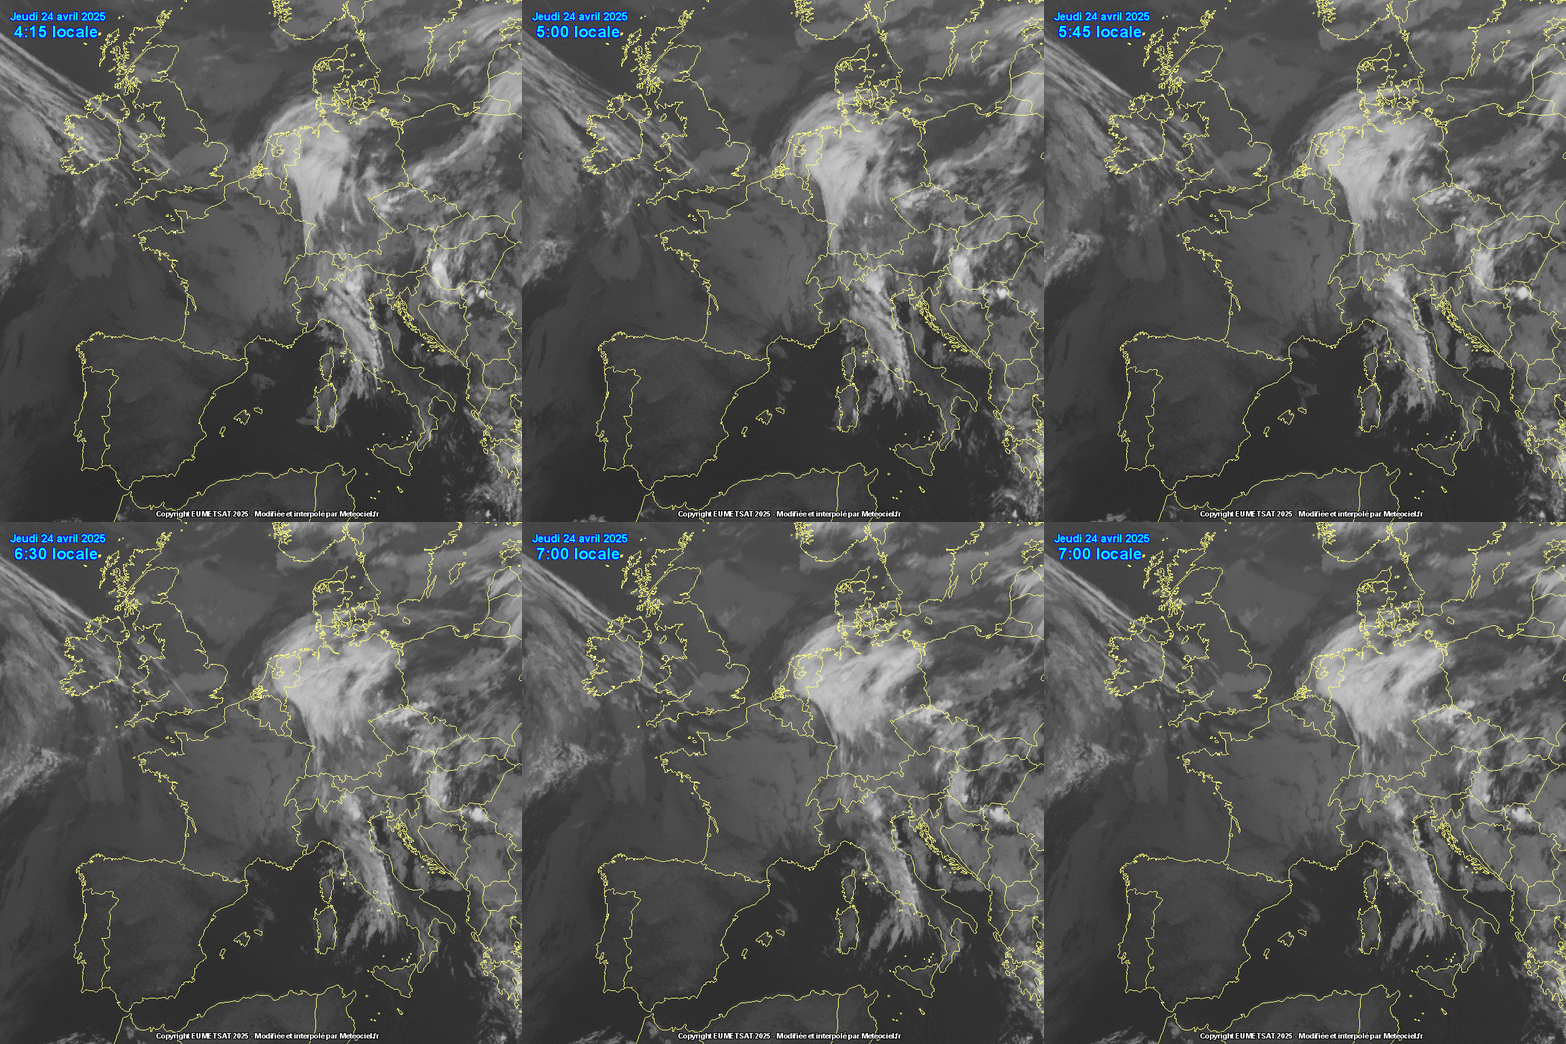
| Animazione Sat - Sat24.com |
 |
| Rete EmiliaRomagnaMeteo |
 |
|
Documento senza titolo
Dati aggiornati il 01/01/70 alle ore 00.00
| Situazione attuale |
Estremi giornalieri |
|
| |
|
MIN |
ora |
MAX |
ora |
| |
Temperatura |
-17.8°C |
-17.8°C |
|
-17.8°C |
|
| |
Umidità |
% |
% |
|
% |
|
| |
Dew Point |
-17.8°C |
-17.8°C |
|
-17.8°C |
|
| |
Heat Index |
-17.8°C |
- |
- |
-17.8°C |
|
| |
Pressione |
0.0 hPa |
0.0 hPa |
|
0.0 hPa |
|
| |
Wind Chill |
-17.8°C |
-17.8°C |
|
- |
- |
|
| |
|
MIN |
ora |
MAX |
ora |
| |
PM10 |
2.9 µg/m³ |
2.3 µg/m³ |
10.34 |
5.7 µg/m³ |
06.04 |
| |
PM2.5 |
2.1 µg/m³ |
1.7 µg/m³ |
00.21 |
5.3 µg/m³ |
06.34 |
| |
CO2 |
438 ppm |
438 ppm |
11.34 |
635 ppm |
03.51 |
|
|
| |
|
|
MEDIA 10 MIN |
|
RAFFICA |
ora |
| |
Velocità |
0.0 Km/h |
0.0 Km/h |
- |
0.0 Km/h |
|
| |
Direzione |
da N |
- |
- |
- |
- |
|
| |
|
ACCUMULO |
|
|
|
| |
Intensità di Pioggia |
0.0 mm/h |
0.0 mm |
giornaliero |
|
|
| |
Intensità Massima |
0.0 mm/h |
0.0 mm |
mensile |
|
|
| |
Storm Rain |
0.0 mm |
0.0 mm |
annuale |
|
|
|
| Estremi mensili |
|
| |
|
|
 MIN MIN |
|
 MAX MAX |
|
| |
Temperatura |
|
-17.8°C |
|
-17.8°C |
|
| |
Umidità |
|
% |
|
% |
|
| |
Dew Point |
|
-17.8°C |
|
-17.8°C |
|
| |
Heat Index |
|
- |
|
-17.8°C |
|
| |
Pressione |
|
0.0 hPa |
|
0.0 hPa |
|
| |
Wind Chill |
|
-17.8°C |
|
- |
|
| |
Raffica di Vento |
|
- |
|
0.0 Km/h |
|
|
| Estremi annuali |
|
| |
|
|
 MIN MIN |
|
 MAX MAX |
|
| |
Temperatura |
|
-17.8°C |
|
-17.8°C |
|
| |
Umidità |
|
% |
|
% |
|
| |
Dew Point |
|
-17.8°C |
|
-17.8°C |
|
| |
Heat Index |
|
- |
|
-17.8°C |
|
| |
Pressione |
|
0.0 hPa |
|
0.0 hPa |
|
| |
Wind Chill |
|
-17.8°C |
|
- |
|
| |
Raffica di Vento |
|
- |
|
0.0 Km/h |
|
|
-18 °C
|
Template Meteo Project v. 8.6.0
Wi-Fi Logger System
Meteo-Project - Osservatorio meteorologico di Cocomaro di Cona (FE)
Davis Vantage Pro 2 - Lat:44.813 N Long:11.689 E


